
Dashboards & Day Book
The main dashboard, the accounting dashboard and the Day Book.
Main dashboard#
Dashboard (permission 100) is the first screen after login. It greets you and shows, computed on the server and scoped to your outlet(s):
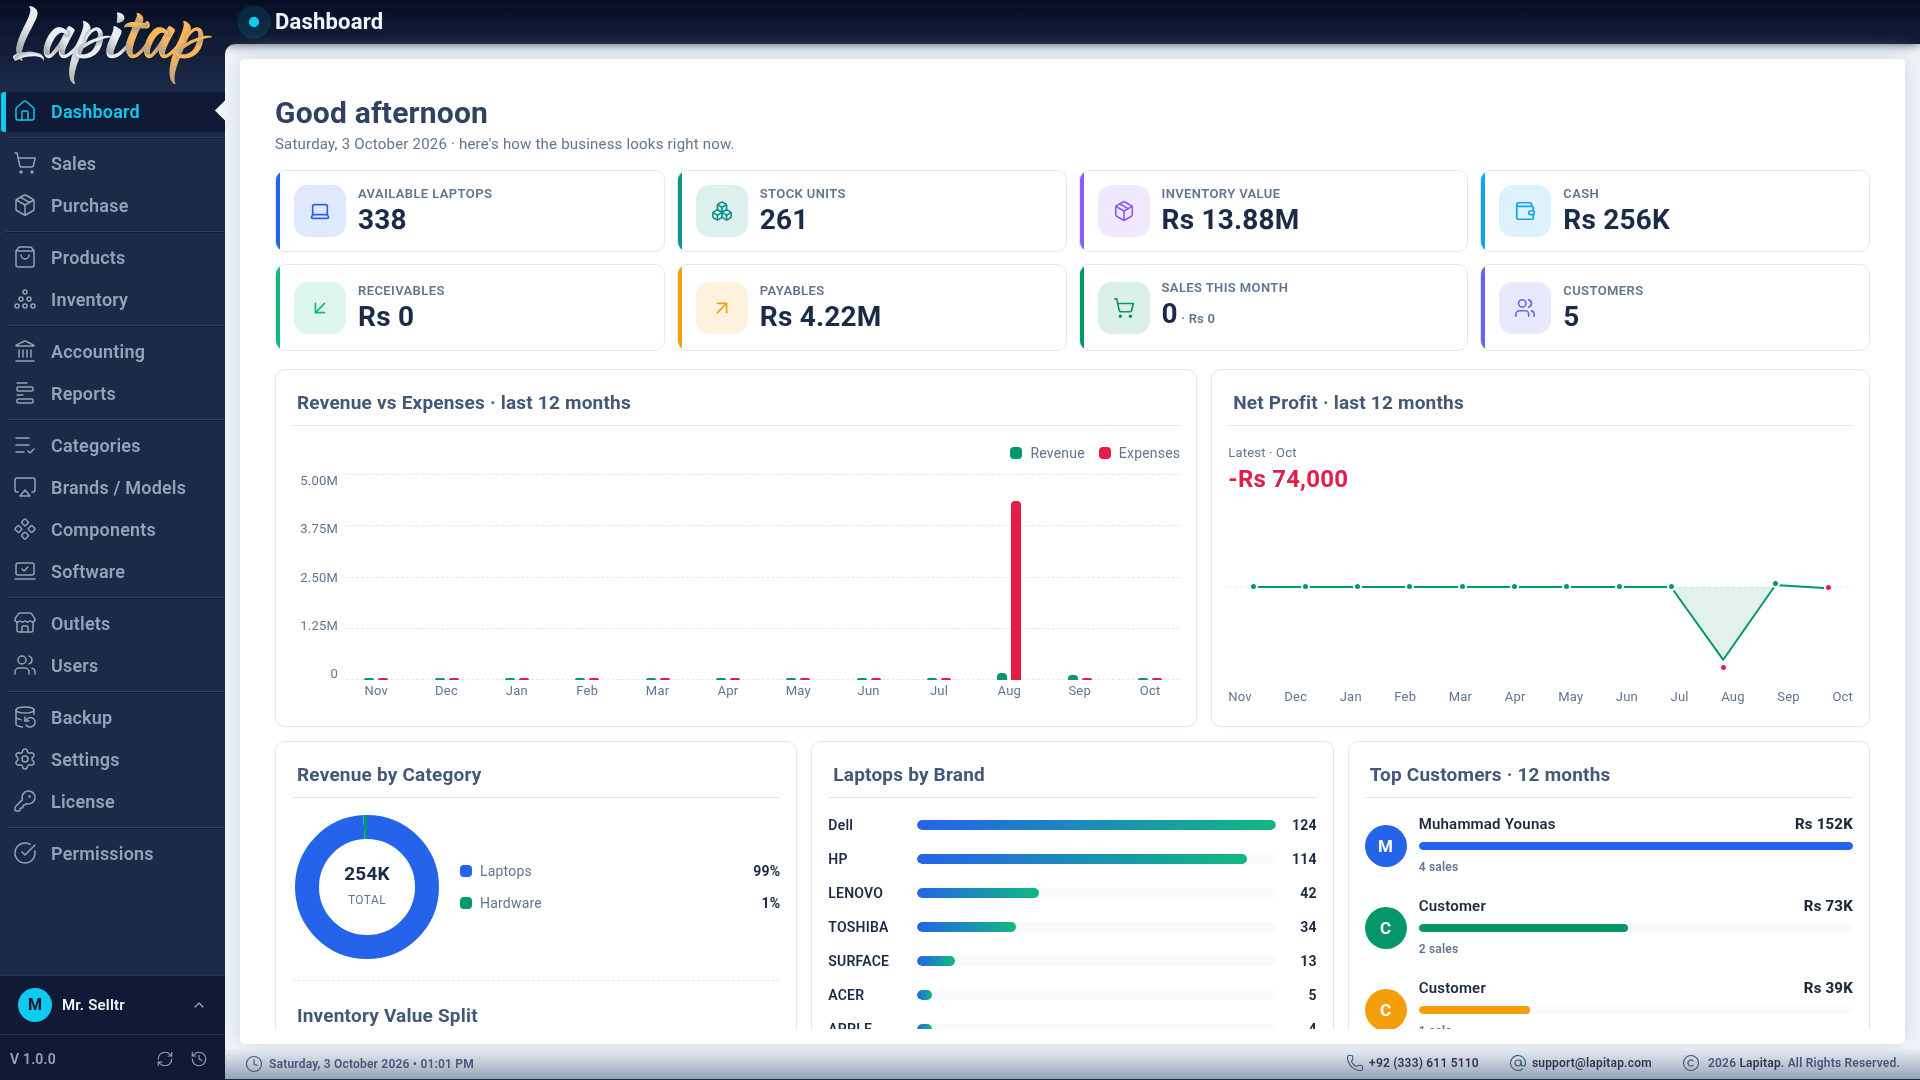
KPI cards: Available Laptops · Stock Units · Inventory Value · Cash · Receivables · Payables · Sales This Month · Customers · Revenue MTD · Expenses MTD · Net Profit · Tax Payable · Capital · Drawings.
Charts and panels: Revenue vs Expenses (last 12 months) · Net Profit (12 months) · Revenue by Category · Inventory Value Split · Laptops by Brand · Top Customers (12 months) · Recent Sales · Stock Alerts (low parts stock).
NOTE
Full inventory valuation, capital and drawings are company-wide figures shown to administrators; outlet users see their own outlet's numbers.
Accounting dashboard#
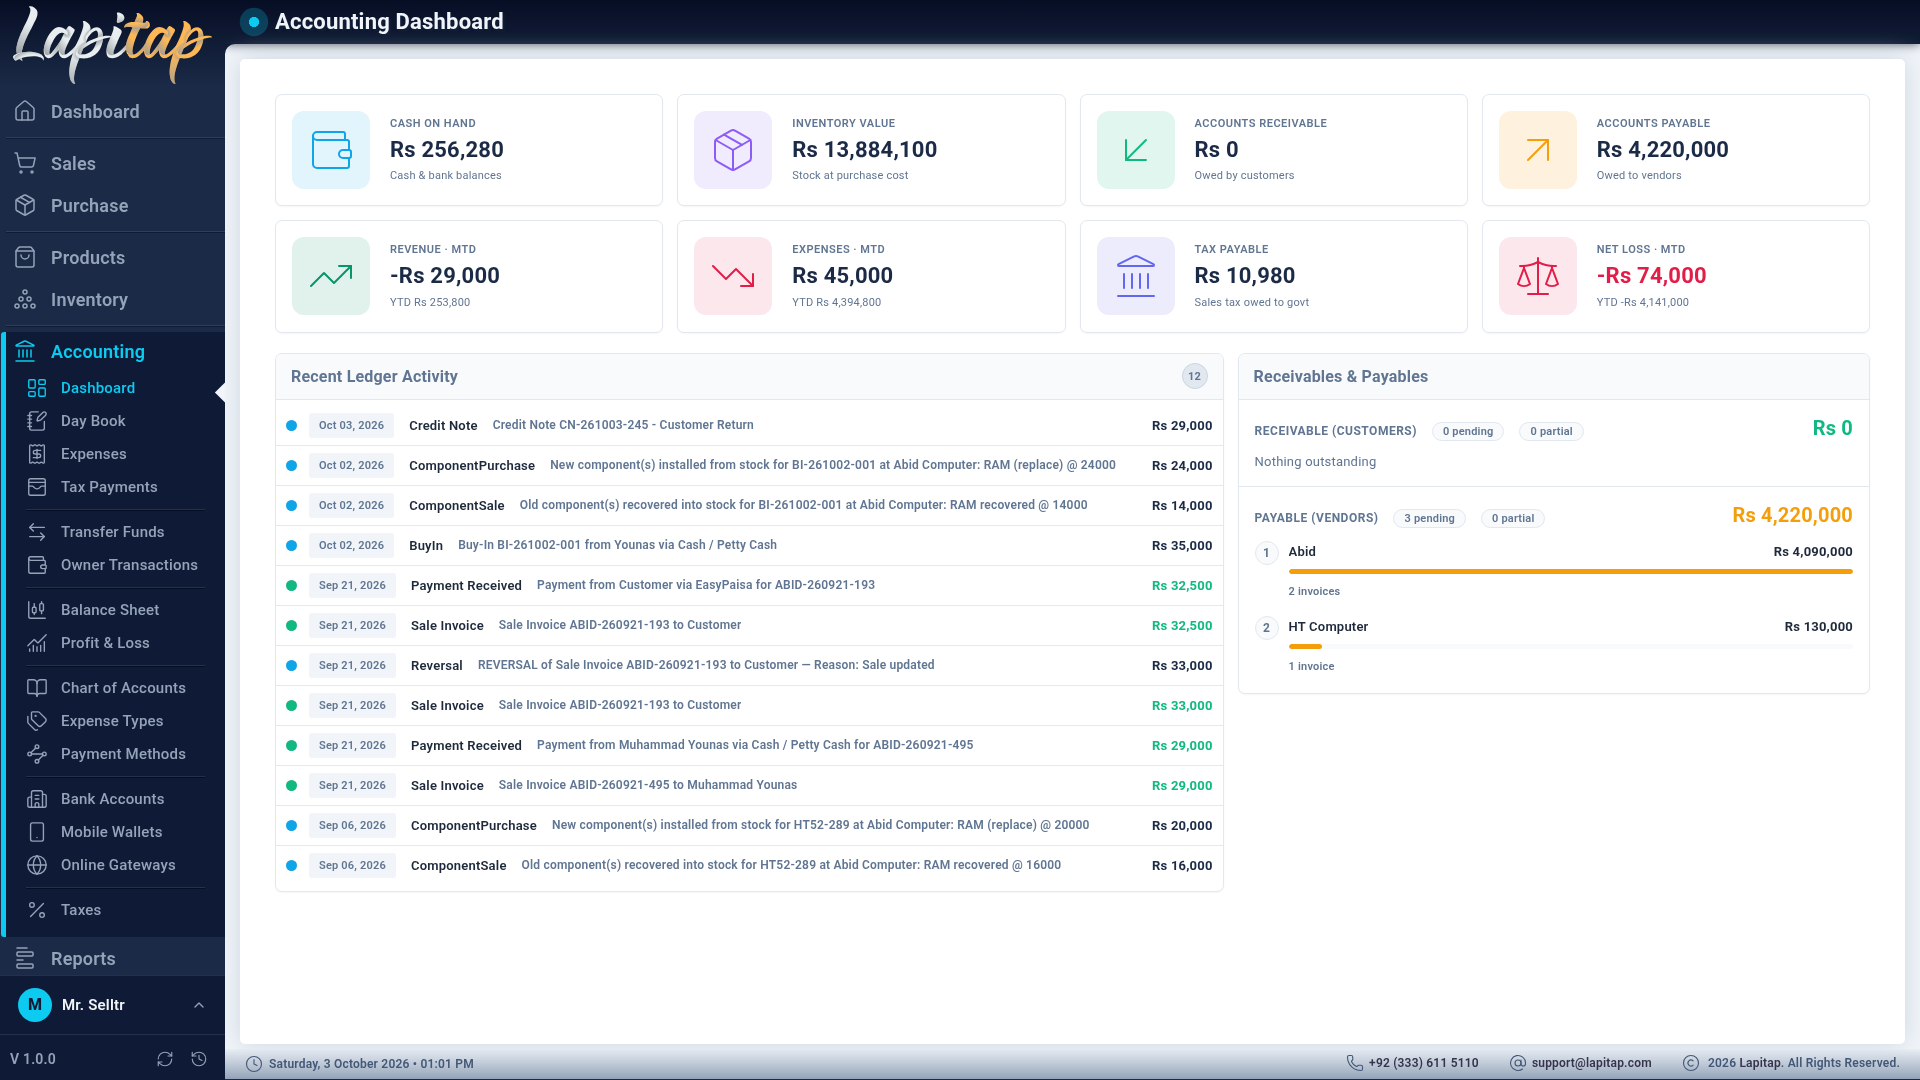
Accounting → Dashboard (600) — headline financial position: cash, inventory, receivables, payables, month-to-date revenue, expenses and net result (each with a year-to-date hint), the top five customers and vendors by amount owed with status pills, and the latest posted journal entries as a feed.
Day Book#
Accounting → Day Book (601) is the chronological ledger of every posting for the chosen period: sales, purchases, payments, expenses, notes, refunds, owner and fund movements, reversals.
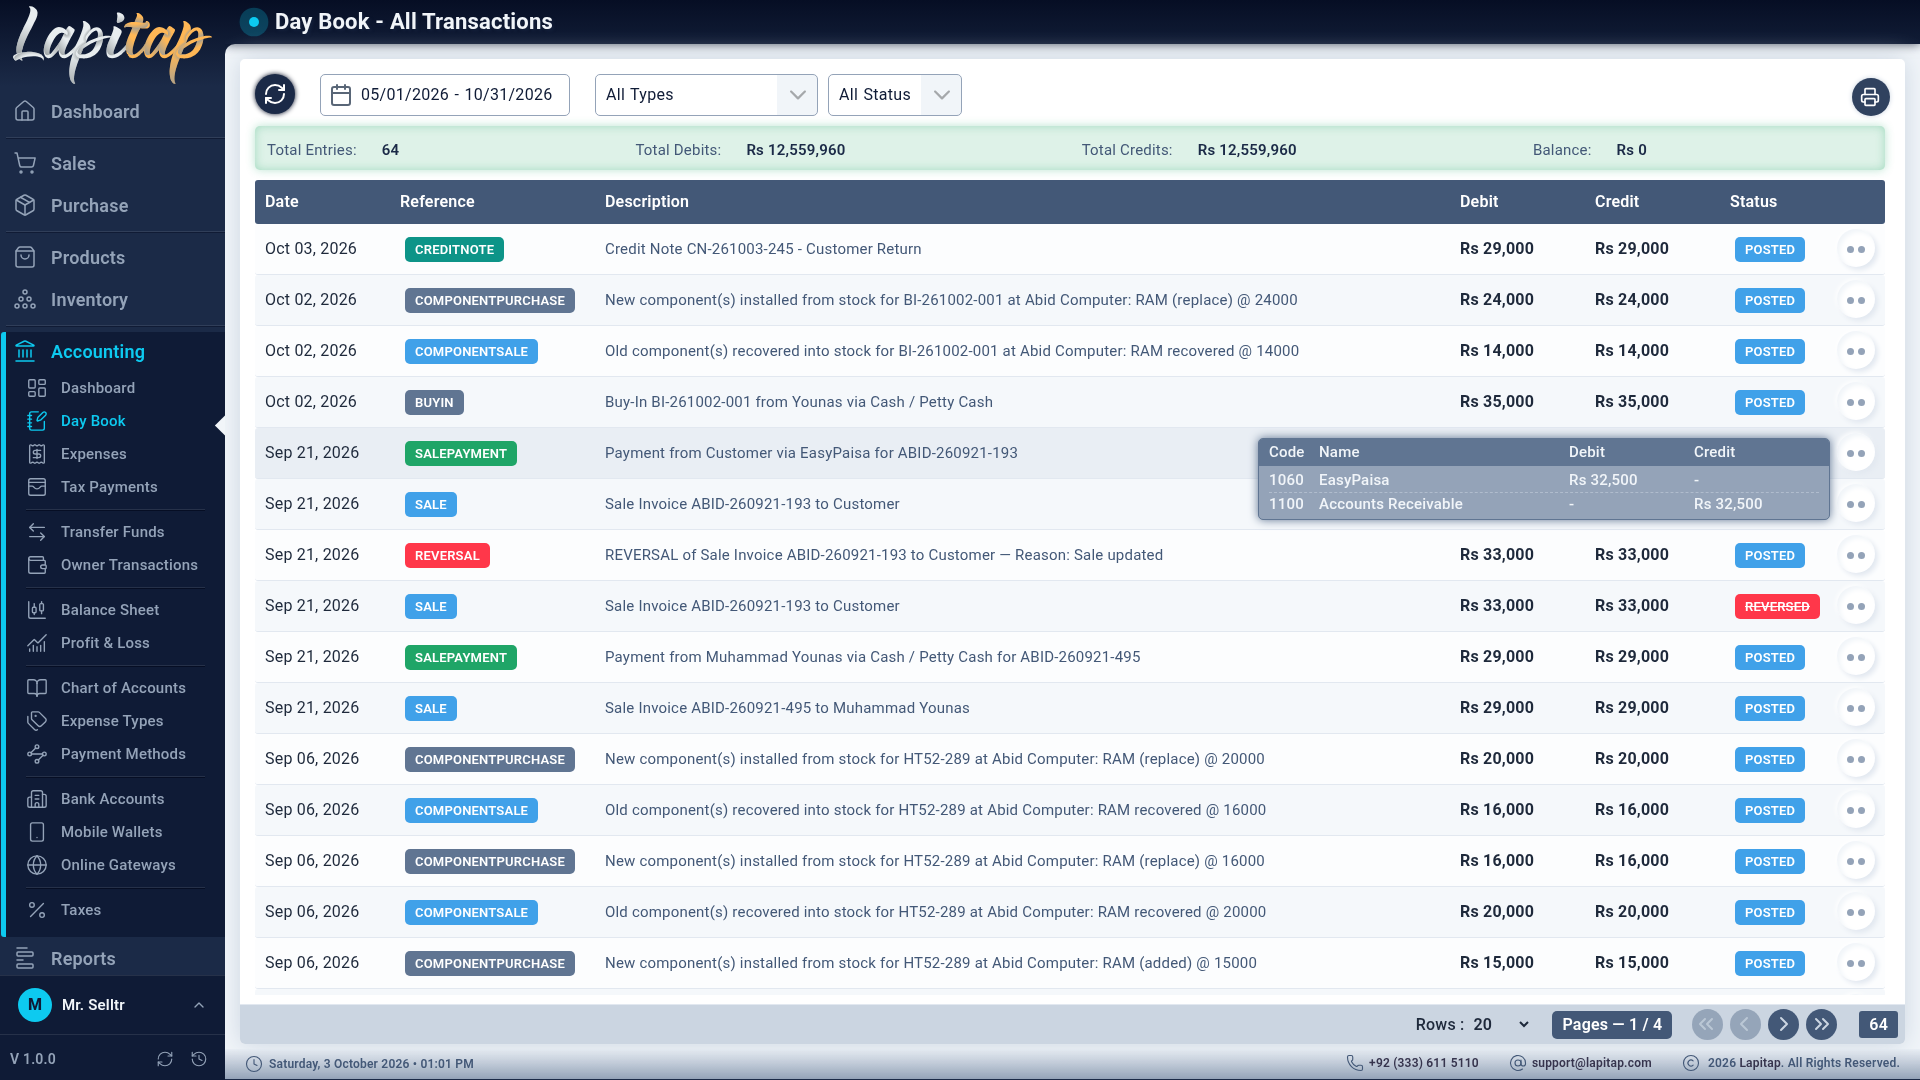
Each row is one journal entry with a reference-type badge (so you see at a glance what produced it). Multi-line entries expand inline to show every posting — account code and name with its debit or credit.
The Day Book is the first place to look when a figure surprises you. It can be printed (Printing).